Daily Stock Picks: Non-S&P 500
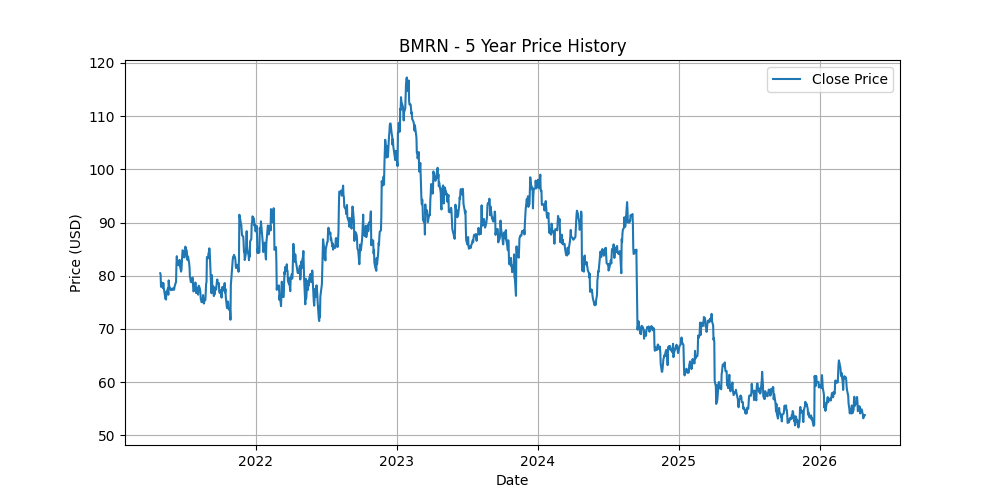
#1 Pick: BMRN
PEG Ratio: 0.62 | P/E Ratio: 29.88 | Dividend Yield: N/A
Company Description
BioMarin Pharmaceutical Inc., a biotechnology company, engages in the development and commercialization of therapies for life-threatening rare diseases and medical conditions in the United States, Europe, Latin America, the Middle East, the Asia Pacific, and internationally. The company's products include VIMIZIM, an enzyme replacement therapy for the treatment of mucopolysaccharidosis (MPS) IV type A, a lysosomal storage disorder; VOXZOGO, a once daily injection analog of c-type natriuretic peptide (CNP) for the treatment of achondroplasia; NAGLAZYME, a recombinant form of N- acetylgalactosamine 4-sulfatase for patients with MPS VI; and PALYNZIQ, a PEGylated recombinant phenylalanine (Phe) ammonia lyase enzyme delivered through subcutaneous injection to reduce blood Phe concentrations. It also develops BRINEURA, a recombinant human tripeptidyl peptidase 1 for the treatment of patients with ceroid lipofuscinosis type 2, a form of Batten disease; ALDURAZYME, a purified protein designed to be identical to a naturally occurring form of the human enzyme alpha-L-iduronidase; and KUVAN, a proprietary synthetic oral form of 6R-BH4 that is used to treat patients with phenylketonuria, an inherited metabolic disease. The company's products under development include BMN 333, a longer-acting CNP for the treatment of multiple growth disorders, such as achondroplasia and hypochondroplasia; and BMN 351, an oligonucleotide for the treatment of duchenne muscular dystrophy. It serves specialty pharmacies, hospitals, non-U.S. government agencies, distributors, and pharmaceutical wholesalers. The company has license and collaboration agreements with and Ares Trading S.A. The company was incorporated in 1996 and is based in San Rafael, California.
Industry & Sector
Industry: Biotechnology | Sector: Healthcare
Price History (5 Years)
Why it was picked:
- ✅ ROE: 5.94% (<=15%)
- ✅ Margin: 10.83% (>10%)
- ✅ Rev Growth: 17.00% (>5%)
- ✅ D/E: 10.561 (<50%)
- ✅ PEG: 0.62 (<2.0)
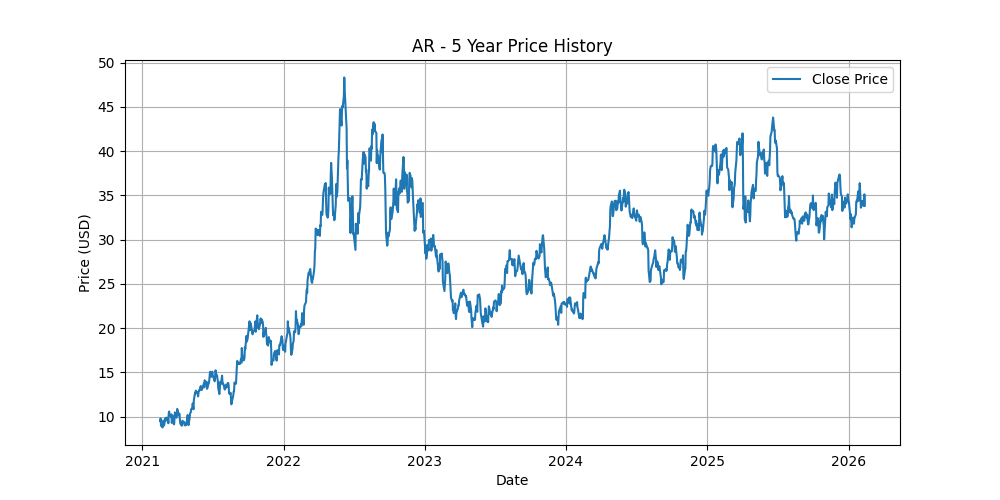
#2 Pick: AR
PEG Ratio: 0.82 | P/E Ratio: 19.07 | Dividend Yield: N/A
Company Description
Antero Resources Corporation, an independent oil and natural gas company, engages in the development, production, exploration, and acquisition of natural gas, natural gas liquids (NGLs), and oil properties in the United States. It operates in three segments: Exploration and Production; Marketing; and Equity Method Investment in Antero Midstream. As of December 31, 2025, the company had approximately 537,000 net acres in the Appalachian Basin; and approximately 168,000 net acres in the Upper Devonian Shale. Its gathering and compression systems also comprise 731 miles of gas gathering pipelines in the Appalachian Basin. The company was formerly known as Antero Resources Appalachian Corporation and changed its name to Antero Resources Corporation in June 2013. Antero Resources Corporation was incorporated in 2002 and is headquartered in Denver, Colorado.
Industry & Sector
Industry: Oil & Gas E&P | Sector: Energy
Price History (5 Years)
Why it was picked:
- ✅ ROE: 9.04% (<=15%)
- ✅ Margin: 12.34% (>10%)
- ✅ Rev Growth: 11.10% (>5%)
- ✅ D/E: 45.706 (<50%)
- ✅ PEG: 0.82 (<2.0)
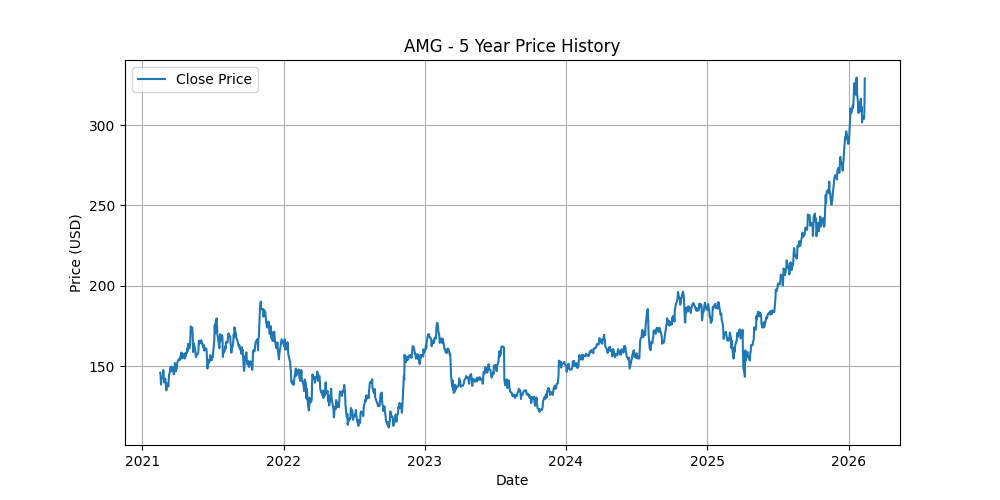
#3 Pick: AMG
PEG Ratio: 0.87 | P/E Ratio: 12.80 | Dividend Yield: 0.01%
Company Description
Affiliated Managers Group, Inc., through its affiliates, operates as an investment management company providing investment management services to mutual funds, institutional clients,retails and high net worth individuals in the United States. It provides advisory or sub-advisory services to mutual funds. These funds are distributed to retail, high net worth and institutional clients directly and through intermediaries, including independent investment advisors, retirement plan sponsors, broker-dealers, major fund marketplaces, and bank trust departments. The company also offers investment products in various investment styles in the institutional distribution channel, including small, small/mid, mid, and large capitalization value and growth equity, and emerging markets. In addition, it offers quantitative, alternative, and fixed income products, and manages assets for foundations and endowments, defined benefit, and defined contribution plans for corporations and municipalities. Affiliated Managers Group provides investment management or customized investment counseling and fiduciary services. Affiliated Managers Group, Inc. was formed in 1993 and is based in West Palm Beach, Florida with additional offices in Prides Crossing, Massachusetts; Stamford, Connecticut; London, United Kingdom; Dubai, United Arab Emirates; Sydney, Australia; Hong Kong; Tokyo, Japan, Zurich, Switzerland and Delaware.
Industry & Sector
Industry: Asset Management | Sector: Financial Services
Price History (5 Years)
Why it was picked:
- ✅ ROE: 19.93% (>15%)
- ✅ Margin: 34.54% (>10%)
- ✅ Rev Growth: 6.20% (>5%)
- ✅ D/E: 64.535 (>=50%)
- ✅ PEG: 0.87 (<2.0)
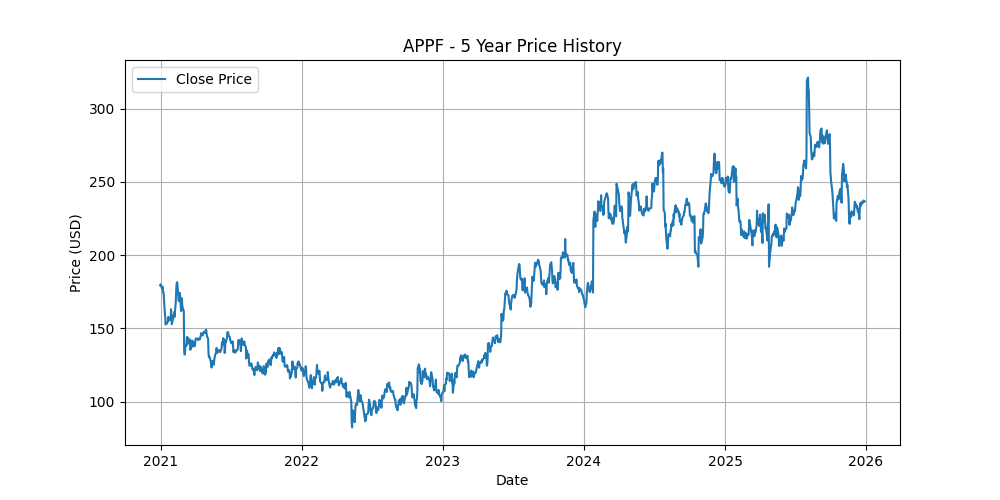
#4 Pick: APPF
PEG Ratio: 7.45 | P/E Ratio: 39.91 | Dividend Yield: N/A
Company Description
AppFolio, Inc., together with its subsidiaries, provides cloud-based platform for the real estate industry in the United States. The company provides a cloud-based platform that assist with accounting, reporting, marketing, leasing, maintenance, workflow automation, and communication services. It offers AppFolio Property Manager Core, a platform that provides the accounting functionalities for small property management companies, as well as serves as a system of record; AppFolio Property Manager Plus, which offers affordable housing and student housing, advanced accounting, advanced data analysis, and read-only API access services; and AppFolio Property Manager Max that provides customer relationship management tools and full database access through a read and write application programming interface services. The company also provides value-added services, such as electronic payment, tenant screening, maintenance, business optimization, resident, and risk mitigation services. It serves property managers, property investors, potential residents, residents, and vendors. AppFolio, Inc. was incorporated in 2006 and is headquartered in Santa Barbara, California.
Industry & Sector
Industry: Software - Application | Sector: Technology
Price History (5 Years)
Why it was picked:
- ✅ ROE: 32.60% (>15%)
- ✅ Margin: 15.27% (>10%)
- ✅ Rev Growth: 20.40% (>5%)
- ✅ D/E: 7.864 (<50%)
- ✅ PEG: 7.45 (>=2.0 or invalid)
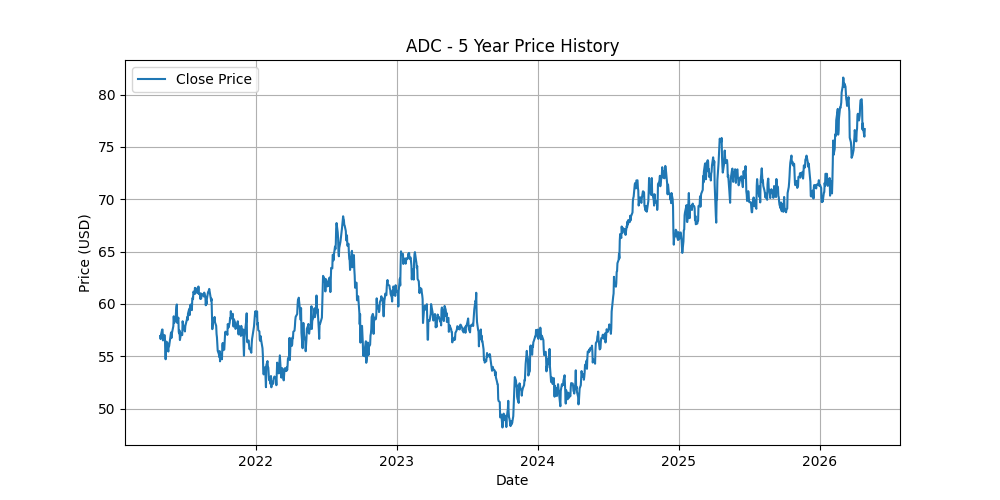
#5 Pick: ADC
PEG Ratio: 0.13 | P/E Ratio: 41.46 | Dividend Yield: 4.22%
Company Description
Agree Realty Corporation is a publicly traded real estate investment trust. The Firm is Rethinking Retail through the acquisition and development of properties net leased to industry-leading, omni-channel retail tenants. As of December 31, 2025, the Company owned and operated a portfolio of 2,674 properties, located in all 50 states and containing approximately 55.5 million square feet of gross leasable area. The Company's common stock is listed on the New York Stock Exchange. Agree Realty Corporation was incorporated in 1971 in Maryland, USA.
Industry & Sector
Industry: REIT - Retail | Sector: Real Estate
Price History (5 Years)
Why it was picked:
- ✅ ROE: 3.70% (<=15%)
- ✅ Margin: 29.25% (>10%)
- ✅ Rev Growth: 18.70% (>5%)
- ✅ D/E: 59.607 (>=50%)
- ✅ PEG: 0.13 (<2.0)
Historical Top Picks
| Date | Ticker | Score | PEG | P/E | Div Yield |
|---|---|---|---|---|---|
| 2026-04-28 | BMRN | 4 | 0.62 | 29.88 | N/A |
| 2026-04-28 | AR | 4 | 0.82 | 19.07 | N/A |
| 2026-04-28 | AMG | 4 | 0.87 | 12.80 | 0.01% |
| 2026-04-28 | APPF | 4 | 7.45 | 39.91 | N/A |
| 2026-04-28 | ADC | 3 | 0.13 | 41.46 | 4.22% |
| 2026-04-27 | BMRN | 4 | 0.62 | 30.21 | N/A |
| 2026-04-27 | AR | 4 | 0.82 | 18.73 | N/A |
| 2026-04-27 | AMG | 4 | 0.87 | 12.79 | 0.01% |
| 2026-04-27 | APPF | 4 | 7.45 | 40.65 | N/A |
| 2026-04-27 | ADC | 3 | 0.13 | 41.23 | 4.18% |
| 2026-04-24 | BMRN | 4 | 0.63 | 29.41 | N/A |
| 2026-04-24 | AR | 4 | 0.83 | 18.53 | N/A |
| 2026-04-24 | AMG | 4 | 0.91 | 12.68 | 0.01% |
| 2026-04-24 | APPF | 4 | N/A | 40.64 | N/A |
| 2026-04-24 | ADC | 3 | 0.13 | 41.74 | 4.15% |
| 2026-04-23 | BMRN | 4 | 0.64 | 29.88 | N/A |
| 2026-04-23 | AR | 4 | 0.80 | 18.72 | N/A |
| 2026-04-23 | AMG | 4 | 0.91 | 12.35 | 0.01% |
| 2026-04-23 | APPF | 4 | 7.45 | 38.68 | N/A |
| 2026-04-23 | ADC | 3 | 0.13 | 41.80 | 4.18% |
| 2026-04-22 | BMRN | 4 | 0.64 | 30.23 | N/A |
| 2026-04-22 | AR | 4 | 0.80 | 18.54 | N/A |
| 2026-04-22 | AMG | 4 | 0.91 | 13.29 | 0.01% |
| 2026-04-22 | APPF | 4 | 7.45 | 41.03 | N/A |
| 2026-04-22 | ADC | 3 | 0.13 | 41.80 | 4.06% |
| 2026-04-21 | BMRN | 4 | 0.64 | 30.48 | N/A |
| 2026-04-21 | AR | 4 | 0.80 | 17.97 | N/A |
| 2026-04-21 | AMG | 4 | 0.89 | 13.43 | 0.01% |
| 2026-04-21 | APPF | 4 | 7.45 | 41.59 | N/A |
| 2026-04-21 | ADC | 3 | 0.13 | 44.65 | 4.03% |