Daily Stock Picks: S&P 500
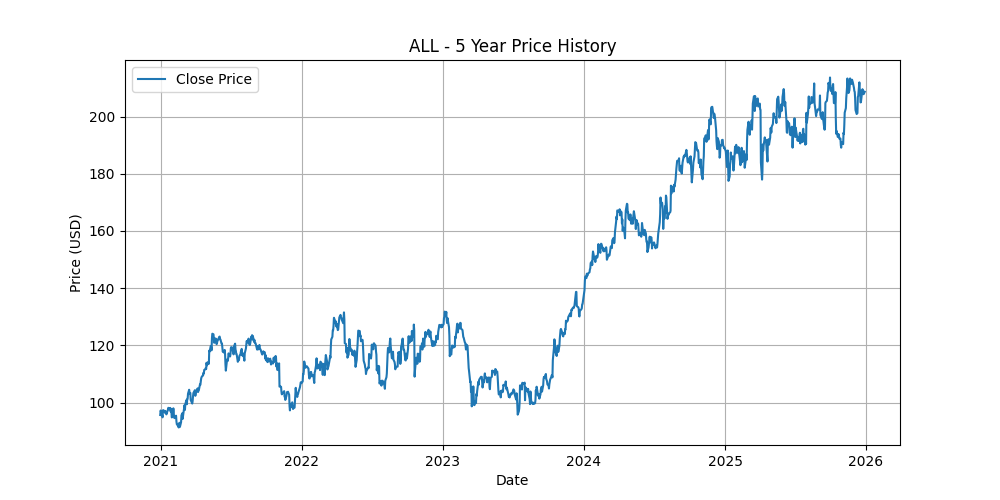
#1 Pick: ALL
PEG Ratio: 0.46 | P/E Ratio: 5.72 | Dividend Yield: 2.02%
Company Description
The Allstate Corporation, together with its subsidiaries, provides property and casualty, and other insurance products in the United States and Canada. It operates in four segments: Allstate Protection; Run-off Property-Liability; Protection Services; and Corporate and Other. The company offers private passenger auto, homeowners, other personal lines and commercial insurance through exclusive agents, independent agents, contact centers and online under the Allstate, National General, Direct Auto and Answer Financial brands. It also provides consumer product protection plans, device and mobile data collection services, and analytic solutions using automotive telematics information, roadside assistance, and protection plans; and insurance products, such as identity protection and restoration. In addition, the company offers property and casualty insurance, as well as engages in company activities and certain non-insurance operations, including expenses associated with strategic initiatives. Further, it offers automotive protection; vehicle service contracts, guaranteed asset protection, road hazard tires and wheels, and paintless dent repair protection; and roadside assistance, mobility data collection services, and analytic solutions using automotive telematics information, identity theft protection, and remediation services. The Allstate Corporation was founded in 1931 and is headquartered in Northbrook, Illinois.
Industry & Sector
Industry: Insurance - Property & Casualty | Sector: Financial Services
Price History (5 Years)
Why it was picked:
- ✅ ROE: 39.52% (>15%)
- ✅ Margin: 15.19% (>10%)
- ✅ Rev Growth: 5.10% (>5%)
- ✅ D/E: 25.091 (<50%)
- ✅ PEG: 0.46 (<2.0)
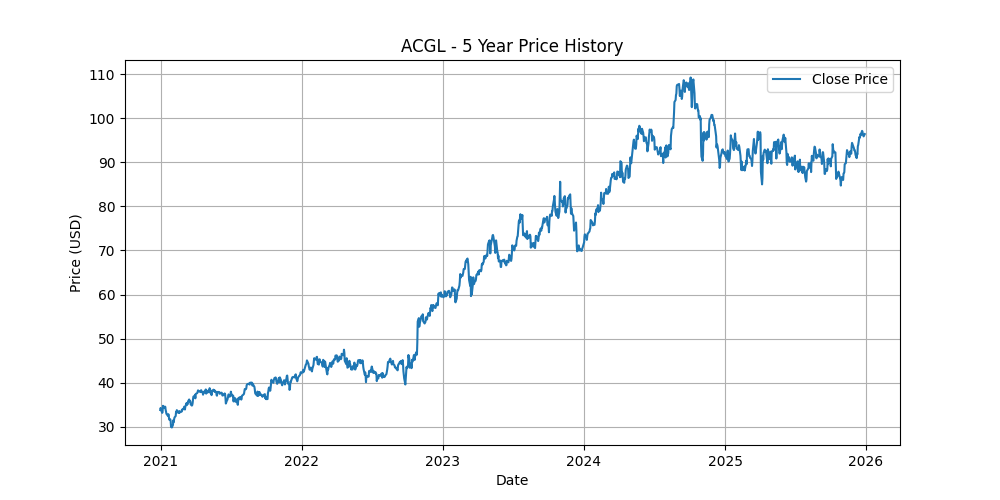
#2 Pick: ACGL
PEG Ratio: 1.05 | P/E Ratio: 8.44 | Dividend Yield: N/A
Company Description
Arch Capital Group Ltd., together with its subsidiaries, provides insurance, reinsurance, and mortgage insurance products in the United States, Canada, Bermuda, the United Kingdom, Europe, and Australia. The company operates through three segments: Insurance, Reinsurance, and Mortgage. The Insurance segment offers commercial automobile; commercial multiperil; financial and professional line liability; admitted, excess, and surplus casualty lines; property and short-tail specialty; workers compensation; and casualty insurance. Its Reinsurance segment provides reinsurance products for casualty; marine and aviation; property catastrophe; property excluding property catastrophe; and other specialty products. The Mortgage segment offers U.S. primary mortgage insurance business written predominantly on loans sold to the Federal National Mortgage Association and Federal Home Loan Mortgage Corporation; reinsurance and underwriting services related to the U.S. credit-risk transfer business and other U.S. mortgage reinsurance transactions; and international mortgage insurance and reinsurance business covering loans. It markets its products through a group of licensed independent retail and wholesale brokers. The company was formerly known as Risk Capital Holdings, Inc. Arch Capital Group Ltd. was founded in 1995 and is headquartered in Pembroke, Bermuda.
Industry & Sector
Industry: Insurance - Diversified | Sector: Financial Services
Price History (5 Years)
Why it was picked:
- ✅ ROE: 19.54% (>15%)
- ✅ Margin: 22.07% (>10%)
- ✅ Rev Growth: 8.50% (>5%)
- ✅ D/E: 11.919 (<50%)
- ✅ PEG: 1.05 (<2.0)
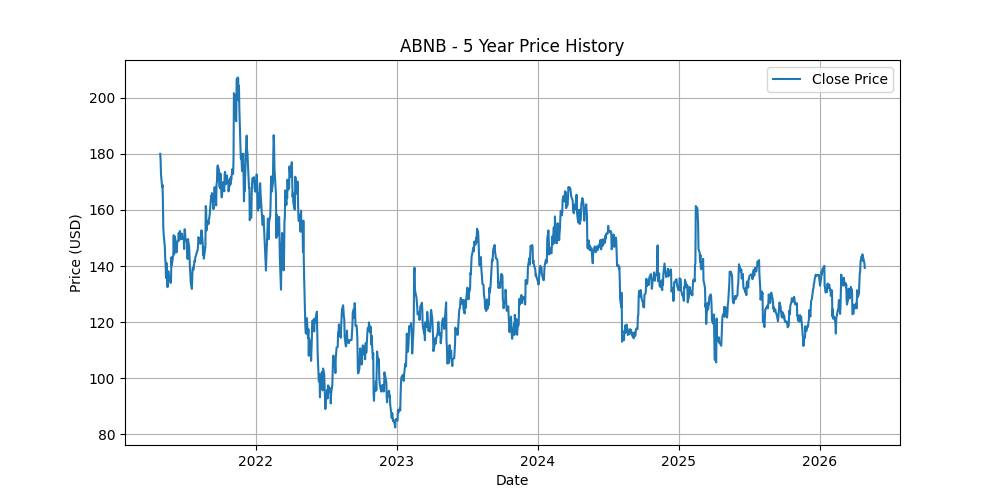
#3 Pick: ABNB
PEG Ratio: 1.34 | P/E Ratio: 34.58 | Dividend Yield: N/A
Company Description
Airbnb, Inc., together with its subsidiaries, operates a platform for stays, experiences, and services worldwide. The company's marketplace connects hosts and guests online or through mobile devices to book spaces, experiences, and services. It also offers gift cards. The company was formerly known as AirBed & Breakfast, Inc. and changed its name to Airbnb, Inc. in November 2010. Airbnb, Inc. was founded in 2007 and is headquartered in San Francisco, California.
Industry & Sector
Industry: Travel Services | Sector: Consumer Cyclical
Price History (5 Years)
Why it was picked:
- ✅ ROE: 30.23% (>15%)
- ✅ Margin: 20.51% (>10%)
- ✅ Rev Growth: 12.00% (>5%)
- ✅ D/E: 27.698 (<50%)
- ✅ PEG: 1.34 (<2.0)
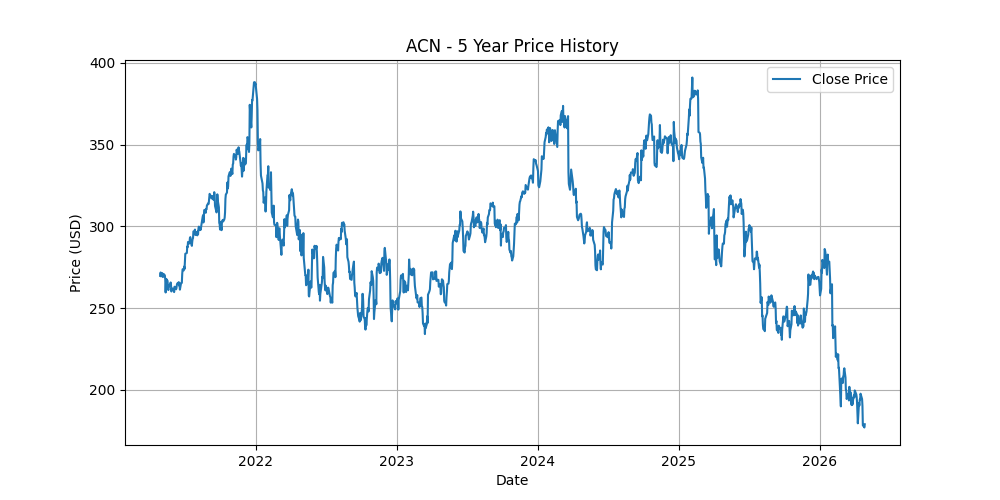
#4 Pick: ACN
PEG Ratio: 1.38 | P/E Ratio: 14.68 | Dividend Yield: 3.68%
Company Description
Accenture plc provides strategy and consulting, industry X, song, and technology and operation services in the Americas, Europe, the Middle East, Africa, and the Asia Pacific. It offers systems integration and application management; security; intelligent platform; infrastructure; software engineering; data, AI, cloud; and automation and global delivery services. The company also operates business processes for specific enterprise functions, including finance and accounting, sourcing and procurement, supply chain, marketing and sales, and human resources, as well as industry-specific services, such as platform trust and safety, banking, insurance, network and health services; and designs, manufactures, and assembles automation equipment, robotics, and other commercial hardware products. It serves communications, media, and technology; financial services; banking and capital markets, and insurance; health and public service; consumer goods, retail, travel services; industrial; life science; and chemicals, natural resources, energy, and utilities sectors. Accenture plc has collaboration with Amazon Web Services (AWS) to deliver transformative digital services to public sector, defense, and national security organizations. It has a collaboration with OpenAI to help enterprise clients unlock new levels of innovation and growth by bringing agentic AI systems; and has a strategic collaboration with Microsoft and Avanade for the development of an agentic factory intelligence system. Accenture plc was founded in 1951 and is based in Dublin, Ireland.
Industry & Sector
Industry: Information Technology Services | Sector: Technology
Price History (5 Years)
Why it was picked:
- ✅ ROE: 24.76% (>15%)
- ✅ Margin: 10.61% (>10%)
- ✅ Rev Growth: 8.30% (>5%)
- ✅ D/E: 25.469 (<50%)
- ✅ PEG: 1.38 (<2.0)
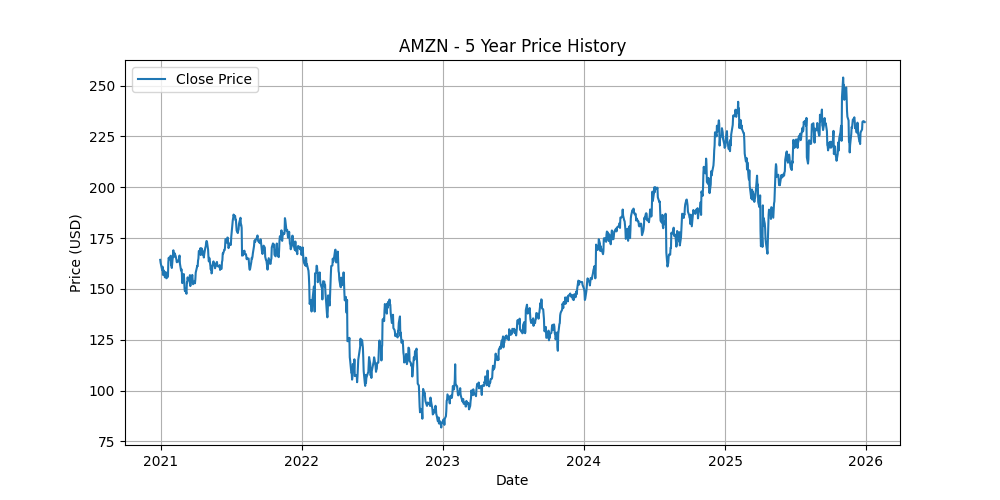
#5 Pick: AMZN
PEG Ratio: 1.91 | P/E Ratio: 36.24 | Dividend Yield: N/A
Company Description
Amazon.com, Inc. engages in the retail sale of consumer products, advertising, and subscriptions service through online and physical stores in North America and internationally. The company operates through three segments: North America, International, and Amazon Web Services (AWS). It also manufactures and sells electronic devices, including Kindle, fire tablets, fire TVs, echo, ring, blink, and eero; and develops and produces media content. In addition, the company offers programs that enable sellers to sell their products in its stores; and programs that allow authors, independent publishers, musicians, filmmakers, Twitch streamers, skill and app developers, and others to publish and sell content. Further, it provides compute, storage, Artificial intelligence, database, analytics, machine learning, and other services, as well as advertising services through programs, such as sponsored ads, display, and video advertising. Additionally, the company offers Amazon Prime, a membership program. The company's products offered through its stores include merchandise and content purchased for resale and products offered by third-party sellers. It serves consumers, sellers, developers, enterprises, content creators, advertisers, and employees. The company was incorporated in 1994 and is headquartered in Seattle, Washington.
Industry & Sector
Industry: Internet Retail | Sector: Consumer Cyclical
Competitor Comparison
| Company | Market Cap | P/E | PEG | Div Yield |
|---|---|---|---|---|
| AMZN (This Stock) Amazon.com, Inc. |
$2798.4B | 36.24 | 1.91 | N/A |
| WMT Walmart Inc. |
$1024.8B | 47.09 | 4.87 | 0.78% |
| TGT Target Corporation |
$58.6B | 15.91 | 3.67 | 3.52% |
| HD Home Depot, Inc. (The) |
$328.2B | 23.17 | 3.07 | 2.80% |
| LOW Lowe's Companies, Inc. |
$135.1B | 20.35 | 2.60 | 1.98% |
Price History (5 Years)
Why it was picked:
- ✅ ROE: 22.29% (>15%)
- ✅ Margin: 10.83% (>10%)
- ✅ Rev Growth: 13.60% (>5%)
- ✅ D/E: 43.435 (<50%)
- ✅ PEG: 1.91 (<2.0)
Historical Top Picks
| Date | Ticker | Score | PEG | P/E | Div Yield |
|---|---|---|---|---|---|
| 2026-04-28 | ALL | 5 | 0.46 | 5.72 | 2.02% |
| 2026-04-28 | ACGL | 5 | 1.05 | 8.44 | N/A |
| 2026-04-28 | ABNB | 5 | 1.34 | 34.58 | N/A |
| 2026-04-28 | ACN | 5 | 1.38 | 14.68 | 3.68% |
| 2026-04-28 | AMZN | 5 | 1.91 | 36.24 | N/A |
| 2026-04-27 | ALL | 5 | 0.46 | 5.67 | 2.03% |
| 2026-04-27 | ACGL | 5 | 1.05 | 8.37 | N/A |
| 2026-04-27 | ABNB | 5 | 1.34 | 35.53 | N/A |
| 2026-04-27 | ACN | 5 | 1.38 | 14.72 | 3.66% |
| 2026-04-27 | AMZN | 5 | 1.91 | 36.57 | N/A |
| 2026-04-24 | ALL | 5 | 0.47 | 5.66 | 1.99% |
| 2026-04-24 | ACGL | 5 | 1.05 | 8.36 | N/A |
| 2026-04-24 | ABNB | 5 | 1.36 | 34.92 | N/A |
| 2026-04-24 | ACN | 5 | 1.47 | 14.41 | 3.66% |
| 2026-04-24 | AMZN | 5 | 1.85 | 36.37 | N/A |
| 2026-04-23 | ALL | 5 | 0.47 | 5.68 | 2.02% |
| 2026-04-23 | ACGL | 5 | 1.05 | 8.42 | N/A |
| 2026-04-23 | ABNB | 5 | 1.35 | 35.17 | N/A |
| 2026-04-23 | ACN | 5 | 1.50 | 14.43 | 3.43% |
| 2026-04-23 | AMZN | 5 | 1.80 | 35.93 | N/A |
| 2026-04-22 | ALL | 5 | 0.47 | 5.64 | 2.00% |
| 2026-04-22 | ACGL | 5 | 1.05 | 8.38 | N/A |
| 2026-04-22 | ABNB | 5 | 1.35 | 36.09 | N/A |
| 2026-04-22 | ACN | 5 | 1.50 | 15.88 | 3.35% |
| 2026-04-22 | AMZN | 5 | 1.80 | 35.33 | N/A |
| 2026-04-21 | ALL | 5 | 0.47 | 5.67 | 2.01% |
| 2026-04-21 | ACGL | 5 | 1.05 | 8.47 | N/A |
| 2026-04-21 | ABNB | 5 | 1.33 | 36.08 | N/A |
| 2026-04-21 | ACN | 5 | 1.52 | 16.22 | 3.34% |
| 2026-04-21 | AMZN | 5 | 1.81 | 35.21 | N/A |